

Breaking down Google Data Studio and how it simplifies your reporting in Advanced Analytics
Introduction
Google made people who hate spreadsheets rejoice when the company announced it was rolling out the free version of Google Data Studio globally, as well as making several improvements to the software. For the first time, there's a high-quality data platform that can be used to access, visualize, transform, collaborate on and share data at scale, all for free
The change was announced as part of Google's goal to help businesses make better decisions by taking full advantage of the data they have access to. The roll-out will remove the previous five report limit, giving users unlimited access to Google Data Studio.
“This change, combined with a very exciting roadmap for 2017, is designed to accelerate our goal to help you fully leverage all your data across your organisation and to ultimately make better decisions,” Google Data Studio product manager Nick Mihailovski said in a blog post announcing the change.
Joao Correia, who is Director of Data Insights at Blast Analytics & Marketing, said that the platform "marks the birth of a new era of how organizations consume, share, and use analytics data to drive insights and create even greater business value."
What is Google Data Studio?
Google Data Studio is an easy to use dashboard and reporting tool that allows users to turn analytics data into informative and easy to understand reports through data visualization.
Data visualization is the representation of data or information in the form of a diagram, chart, picture or other form of visual aid. In a world of SEO, comprised of masses of numbers and statistics, data visualization helps to ensure the information and its insights are easy to digest, absorb and access for different audiences and stakeholders.
Google Data Studio is an expansion of the Google Analytics 360 suite, which is a data management platform. The goal of Google Data Studio is to make data sources more accessible and useful by focusing on insights, rather than gathering data and data entry. It works by syncing existing data from Google Analytics and turning it into branded, interactive reports.
It allows for 4 main functions:
Consolidation – users can look at all Google Analytics data in one place.
Automation – it has built-in connections to a number of data sources so all data is automatically refreshed every hour. This gives users updates in real time and eliminates the need to schedule data refreshes for reports.
Interaction – custom dashboards allow users to clean up data with audience segments, filters and timelines, so you can choose which data set to look at.
Sharing – dashboards can be shared with all stakeholders for free.
Google Data Studio was designed for everyday business users and allows you to ask questions of the insights and data - the deeper you dig, the more you will find.
It is currently set up as two tools, the Data Sources Tool and the Reporting Tool. The Data Sources Tool is where you connect your Google Data Studio account to your data sources, such as Google Analytics. The Reporting Tool is where you create or view reports. Since Google Data Studio has the same collaborative features as Google Sheets and Docs, the reports are able to be viewed and edited by multiple users simultaneously.
You are also able to source third party data from Google Sheets and add this to your reports, which means that you can pull information from multiple sources, even from the same report.
It allows for 4 main functions:
You have a problem collecting all your data in one place.
You are sick of looking at table reports and want a customizable dashboard.
You want everyone to be able to check out the most important data without asking for a report.
You want reports to be interactive and branded.
To use Google Data Studio and create the reports, you have to be signed into your Google account and be able to use Google Drive - this is how the analytics and data sources are stored and leveraged. There are a range of video tutorials on the Google website explaining how to use Google Data Studio.
Google Data Studio Features + Benefits
Everyone gets excited when something is free, but that isn’t the only reason why people around the world are so enthusiastic about Google Data Studio. It has been specifically built for reporting and dashboarding, so the interface is better looking than alternatives and makes it very easy to show results.
Analytics has always been overwhelming and confusing, even for those working in it. Analytics reporting used to mean downloading Google Analytics data and exporting it into an Excel spreadsheet to analyze, format and create diagrams, charts and graphs, but now Google Data Studio does away with this time-consuming and tedious process. So for those who hate spreadsheets - it’s a big deal!
The other reason people are so excited about recent improvements to Google Data Studio is that it now allows users to pull reports from multiple sources rather than just Google Analytics and AdWords. Reports can be pulled from Attribution 360, Soundcloud SQL, MySQL or any custom reports you have in Google Sheets.
This means that, if it can be put on a spreadsheet, then it can be put into Google Data Studio. So, even though Facebook analytics isn’t included, if data from Facebook exports to Google Sheets, then that information can be included within your Google Data Studio dashboard.
There are also a number of other benefits to Google Data Studio including:
No widget limit
The Google Analytics embedded application programming interface (API) limits users to seven dimensions, for example, keywords or website names, and ten metrics, for example, number of clicks or new users, in a single API request.
In contrast, Google Data Studio doesn’t use API, so there are no limits. Once you have connected Google Analytics, you can access all your Google Analytics data at once.
Calculated metrics
This allows you to create new dimensions and metrics based on existing fields in your data source, to boost your reporting and analysis. It also allows you to clean up inconsistent campaign parameters (which are useful for telling you how effective campaigns are) and customize channel grouping, without being limited to only a certain amount per view.
Design
Google Data Studio gets rid of ugly dashboards and gives you the option of using ready-made visual themes, creating your own themes or making changes only to a specific widget or page.
Shareability
Google Data Studio uses the same functionality as Google Docs and Google Sheets, so you only have to click one button to let other people view and edit reports. You can set view and edit permissions, and you do not have to give or get permission to Google Analytics to find the reports. You can also add dynamic date range controls to all your reports, which means that everyone can update the time frame as they wish, so you save time on updating reports.
Data preparation
Google Data Studio makes it easy to prepare data to display the metrics as desired, thanks to a special interface that gives you a preview of the data fields. You can update both the data types and field names before importing the data.
Gentle learning curve
Even though Google Data Studio is a fairly new tool, it has been designed to be easy to use and doesn’t require technical knowledge to make a simple dashboard. There are also a range of default dashboards available that you can apply to your data, and they work in the same way as the default Google Analytics dashboard.
Consolidation
Google Data Studio is a good tool for bringing all your Google data together in a single place with sharing abilities.
Filters
Users are able to filter data in many ways, and Google Data Studio has made it easier to reuse filters on multiple charts.
Google Data Studio for Google Analytics reporting
Although there is a free reporting add-on for Google Analytics that automatically imports your data into Google Sheets, Google Data Studio is a much more dynamic reporting tool and it represents a better solution to Google Analytics reporting for both small and large businesses.
Google Data Studio provides integration for the Google ecosystem between data, analysis and reporting, but it is not restricted to only Google sources.
If, however, you want to set up Google Analytics as a data source, then sign in to Google Data Studio and find the data sources tab. Click the plus sign and, in the connectors panel, select 'Google Analytics', and then 'Connect'. All your important Google Analytics data can now be displayed in one place. For Google Analytics reporting, click 'Create report', and then 'Add to report'
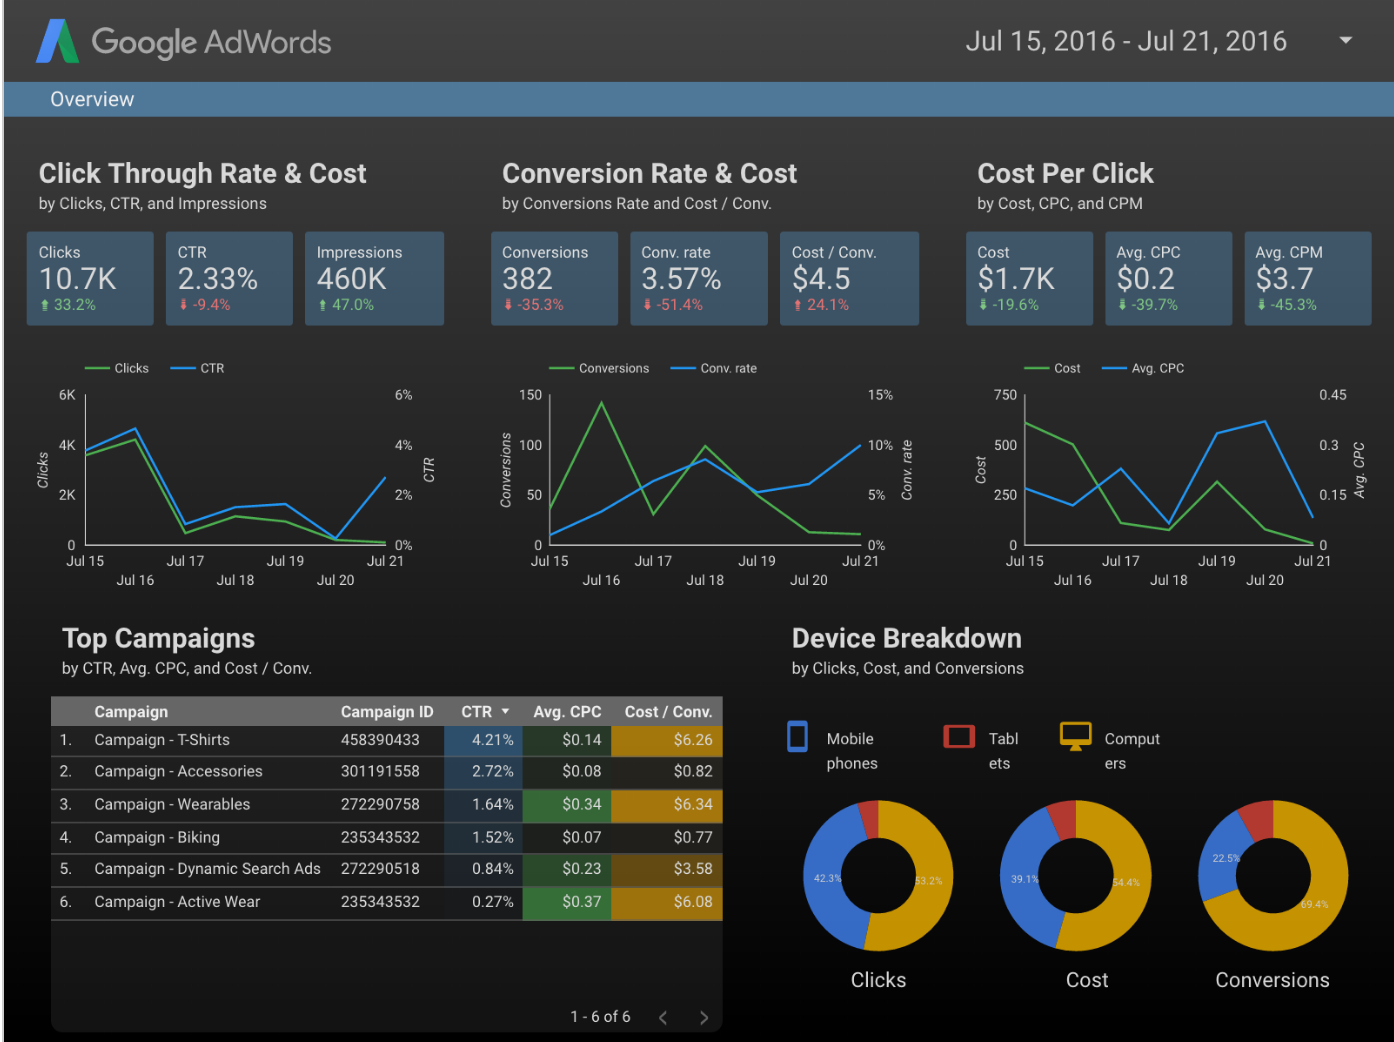
This represents a pretty dramatic shift compared to the visualization options previously available with the Google Analytics interface. You can now add images, company branding, multiple pages and control features to all your marketing analytics, which wasn’t possible with on Google Analytics dashboards.
Making the most of Google Data Studio
To get the most out of Google Data Studio you should try the following:
Watch tutorial videos
Google Data Studio has some good video tutorials that explain how to get started, important features and different ‘How Tos’.
Browse the template gallery
There are a lot of templates available, so take time to explore the gallery to get ideas, and practice making your own great dashboard.
Add filter controls
With filter controls, you can choose which dimension to use in your filter control, which metric to use, how to sort the filter control and different styling options.
Learn shortcuts
It is helpful to memorise a list of common or useful shortcuts to make things quicker and easier.
Use different colours
Numerous studies have shown that humans process data more effectively and are more likely to engage when color is used to convey meaning. Make sure not to overdo it, but use colors to bring extra meaning to your visualisations (and make your reports more enjoyable to read at the same time).
Add Google Analytics tracking code
Adding a Google Analytics tracking code is good if you want to track activity and usage on a report, or if you want to track multiple reports in one place.
Name your pagess
This might seem like an obvious one, but it’s easy to overlook. The default page names will be 'Page 1, Page 2', and so on, but rename the pages so you know what’s on each particular page.
Group objects
It is a good idea to group multiple objects on a page if you want a filter control to only apply to one or a few charts on the page, or if you want to apply the date range control to a limited number of objects.
Limitations of Google Data Studio
Despite the excitement over Google Data Studio, there are still some limitations to the tool. The biggest one is that although Google Data Studio does provide great integration for the Google ecosystem, there are over 2,000 data sources available for marketing analytics and Google Data Studio connects to 12. That means you don’t get insight into other popular channels, particularly Facebook, Twitter, Bing and Instagram.
Other limitations:
Google Data Studio is still in its beta stage, so there have been reports of data sometimes not loading correctly.
It can’t be white-labelled with your own custom domain.
Reports can’t be shared on an automatic schedule.
There are no blending capabilities, so you can't blend data from multiple sources.
An inability to export reports - the reports can be shared directly if the person has a Google account, but there is no proper export feature.
Analytics capabilities are still behind industry leaders, particularly when it comes to creating custom groups, metrics and trend lines.
Despite these limitations, Google Data Studio has great potential and, as a Google product, it will continue to see meaningful updates.
You only get out what you put in...
Reporting is a vital part in your marketing analytics, and Google Data Studio is a great tool for getting the job done. But if your data isn't right, you'll be wasting your time.
If your UTM links aren't right, you'll end up with incomplete and inaccurate data. When it comes time to reporting, you might not even realize you're barking up the wrong tree.
So it's important to learn how to get your UTM tracking links right, and for that you need the right tool for the job - that's where we come in.
We've created the world's easiest way to create and manage UTM links. In fact, it's 2.8x faster than the next best alternative!
It even does a lot of the hard work for you (like keeping things lowercase and replacing spaces). It's also got some added features that fix many of the limitations and challenges that come with UTM tracking (like link shortening, image attachments, and private data). We offer a 14-day all-access free trial. Get started here.